

Sales Can Be Healthy While the Business Gets Less Profitable
Every retail business eventually runs into a week, a month, or a quarter where the numbers tell two completely different stories. The top-line dashboard is green.
Target hit. The sales team is celebrating, the pacing report looks confident, and store traffic or conversion figures appear stable.
Yet when the accounting closes, the operating margin has dropped, net profit has narrowed, and the cash flow expected from that revenue volume simply did not materialize.
This disconnect catches operators off guard because modern management reporting tends to treat revenue as an unvarnished proxy for business health.
Revenue is immediate, visible, and easy to measure in real time. Profitability, by contrast, is delayed, multi-variable, and quiet.
When a store or brand hits its top-line target, leadership instinctively assumes the underlying engine is functioning as intended.
It often is not. Revenue measures customer transaction volume; it does not measure value capture.
When you hit a sales target while your operating profit deteriorates, your business is working harder to retain less money.
The issue is rarely a mystery of sudden overhead or unexpected overhead creep.
In retail environments, profitability erosion under healthy sales usually comes down to three silent mechanisms: discount dependency, margin rate compression, and unfavorable mix shift.
Understanding how these three forces interact is the difference between running a business that creates sustainable wealth and running a high-turnover clearinghouse that merely generates activity.
The Mechanics of Margin Erosion
To understand how profit can decay underneath strong sales, you have to separate two variables that operators frequently conflate: margin rate (the percentage of revenue kept as gross profit) and margin dollars (the absolute cash profit generated by transactions).
A common assumption is that high sales volume can easily compensate for a lower margin rate.
If an item usually sells at a 50% gross margin, discounting it to clear more units or to hit a top-line goal sounds harmless if the total register receipts end up higher.
But the arithmetic of margin erosion is asymmetrical.
When a retailer takes a product that normally generates $100 in revenue with a 50% gross margin ($50 in margin dollars) and discounts it by 20% to $80, the cost of goods sold remains fixed at $50.
The new margin dollar contribution is $30. While the discount was only 20%, the margin dollar yield fell by 40%.
To replace the gross profit of the original single transaction, the business now needs to sell 1.67 units instead of 1.
It must generate 33% more gross revenue and handle 67% more physical inventory, packing, transaction fees, and customer service simply to make the exact same dollar amount of profit it previously captured with a single sale.
This asymmetry explains why revenue targets can be met with flying colors while bottom-line profit vanishes.
When top-line volume is driven by price concessions, extra inventory turns do not build profit; they build operational friction while yielding fewer net dollars.
The second, even quieter mechanism is category mix shift. You can hold every price point firm, avoid broad discounting entirely, and still see profitability hollow out under healthy gross sales.
This happens when the composition of your sales changes faster than your top-line targets account for.
Consider an independent outdoor and technical apparel retailer that targets $500,000 in monthly sales. In a healthy baseline month, that revenue breaks down across three distinct categories:
-
Category A: Technical outerwear and private-label apparel, generating $200,000 in sales at a 60% gross margin ($120,000 in margin dollars).
-
Category B: Footwear and branded technical gear, generating $200,000 in sales at a 42% gross margin ($84,000 in margin dollars).
-
Category C: Hard goods, electronics, and branded accessories, generating $100,000 in sales at a 24% gross margin ($24,000 in margin dollars).
Under this baseline mix, the retailer generates $500,000 in revenue and $228,000 in gross margin dollars, producing an overall blended gross margin rate of 45.6%.
Now suppose that in the following month, the retailer hits that exact same $500,000 sales target. To the executive team looking only at the pacing board, the month is on plan.
But underneath the headline, consumer demand shifted.
A warm season softened outerwear demand, while a spike in interest for third-party electronics and branded GPS units carried the store across the finish line.
The mix now looks like this:
-
Category A: Apparel drops to $100,000 at a 60% margin ($60,000 in margin dollars).
-
Category B: Footwear stays flat at $200,000 at a 42% margin ($84,000 in margin dollars).
-
Category C: Electronics and hard goods surge to $200,000 at a 24% margin ($48,000 in margin dollars).
The top-line number is unchanged at $500,000. But total margin dollars dropped from $228,000 to $192,000.
That is a $36,000 reduction in gross profit—a nearly 16% decrease in gross profit dollars—on the exact same sales volume. The blended margin rate fell from 45.6% to 38.4%.
If the retailer operates with $180,000 in fixed monthly operating expenses (rent, payroll, utilities, marketing), baseline net operating profit under the original mix was $48,000.
Under the new mix, net operating profit fell to $12,000.
The sales target was hit. The store looked busy. Yet 75% of the company’s net profit vanished in thirty days simply because lower-margin products carried the weight of the revenue goal.
The Margin Contribution Velocity Lens
To prevent this blind spot, managers need a way of thinking that tracks revenue quality rather than revenue scale.
A reliable thinking device for this is Margin Contribution Velocity.
It asks a simple diagnostic question: For every additional thousand dollars of top-line revenue being recorded, are margin dollars accelerating, pacing evenly, or decelerating?
When sales are healthy and structurally sound, margin dollars scale at or above your budgeted blended margin rate.
When sales are being bought through discounts or propped up by low-margin mix shifts, margin dollars decelerate relative to sales velocity.
Top-line revenue tells you how much product you moved through the door. Margin dollars tell you how much financial fuel you brought into the building.
When you evaluate performance, top-line sales should never be credited as a victory until the margin yield confirms it.
A helpful rule to adopt across retail teams is simple: Never reward revenue that produces dilutive margin dollars without an explicit, pre-planned strategic purpose.
There are valid times to sell lower-margin or discounted goods: clearing seasonal inventory to free up working capital, customer acquisition with proven follow-on purchasing, or liquidating dead stock before depreciation accelerates.
But those are tactical trade-offs, not routine business operations.
When a business relies on low-margin categories to disguise softness in core, high-margin categories, it is burning operational capacity to create an illusion of health.
To put this diagnostic into practice, replace top-line check-ins with three specific reviews:
-
The Margin Dollar Variance Check: Do not ask whether the store or category met its sales target. Ask whether it delivered its target gross margin dollars. If an apparel department was budgeted to deliver $100,000 in revenue at a 55% margin, its target was not $100,000; its target was $55,000 in gross profit. If it hit $110,000 in revenue but yielded only $48,000 in margin dollars due to promotional discounting, that department underperformed by $7,000, despite beating its top-line target by 10%.
-
The Category Share-of-Volume Shift: Track what percentage of total weekly revenue is being produced by your lowest-margin quartile of products. If that tier’s share of total sales increases by more than three to five percentage points, investigate immediately. A surge in low-margin category sales is often an early warning sign that foot traffic is finding fewer reasons to buy your primary, higher-margin offerings.
-
The Effective Discount Rate Audit: Measure the gap between original retail price and realized transaction price across every promotional campaign. If an increase in units sold does not generate an absolute increase in net margin dollars after factoring in transaction and handling costs, the promotion failed, regardless of gross receipts.
When managers begin reviewing retail performance through this lens, priorities adjust fast.
Inventory planning stops over-indexing on high-turnover, low-margin products that inflate gross sales while exhausting warehouse and floor capacity.
Merchandising focuses on defending and promoting high-yield categories rather than running blunt, store-wide discount events to rescue monthly targets.
Hitting your sales number is a measure of customer activity; holding your margin is a measure of business viability.
When sales look strong but cash feels tight, stop scrutinizing your general overhead and look directly at your transaction mix.
Yet fixing mix shift inside existing inventory raises an even more critical question: what happens when your sales mix shifted not because of merchandising decisions, but because customer willingness to pay for your core categories permanently decoupled from your cost structure?
AI Diagnosis
AI Prompt
Act as a seasoned retail merchandising and finance analyst. Using the retail sales and product performance data I paste below, run a rigorous Margin Contribution Velocity audit to diagnose whether healthy top-line revenue is masking underlying profit decay. Start by calculating total revenue, total margin dollars, and the blended gross margin percentage across the entire dataset. Next, break down performance by category or tier to identify any unfavorable sales mix shifts, flagging where low-margin volume is artificially carrying the top-line target at the expense of high-margin yield. Then, identify any promotional or discount erosion by evaluating the gap between transaction volume and actual margin dollar realization. Conclude with a concise, prioritized diagnostic table that shows each category’s revenue share versus its margin dollar share, followed by three concrete operational actions: one product category or promotion to immediately restrict or re-floor to stop margin dilution, one high-margin category to prioritize for volume recovery, and one specific threshold rule for what minimum gross margin dollar yield must be met before future promotions are approved. Here is my performance data: [Target revenue: $150,000. Actual revenue: $155,000. Category breakdown: Technical Outerwear budgeted for $60,000 at 58% margin, actual came in at $42,000 at 54% margin due to an end-of-month 15% markdown. Trail Footwear budgeted for $50,000 at 44% margin, actual came in at $51,000 at 43% margin. Camping Accessories and Tech budgeted for $40,000 at 26% margin, actual surged to $62,000 at 24% margin. Total overhead costs are $48,000.]
AI Output
Margin Contribution Velocity Audit
Top-line revenue exceeded budget by $5,000 (+3.3%), but net operating profit dropped by $7,710 (-40.2%).
The business achieved a headline sales beat while severely eroding operating cash flow due to a negative product mix shift combined with across-the-board margin rate dilution.
Macro Financial Performance: Budget vs. Actual
Fixed overhead costs remained constant at $48,000, meaning every dollar of lost gross margin flowed directly to the bottom line:
| Metric | Budget | Actual | Variance ($ / bps) | Variance (%) |
| Gross Revenue | $150,000 | $155,000 | +$5,000 | +3.33% |
| Gross Margin Dollars | $67,200 | $59,490 | -$7,710 | -11.47% |
| Blended Gross Margin Rate | 44.80% | 38.38% | -642 bps | -14.33% |
| Fixed Overhead | $48,000 | $48,000 | $0 | 0.00% |
| Net Operating Profit | $19,200 | $11,490 | -$7,710 | -40.16% |
Category Performance & Sales Mix Shift
The headline sales target was hit entirely because low-margin items substituted for core, high-margin inventory:
-
Camping Accessories & Tech (Surge Category): Sales exploded to $62,000 against a $40,000 budget (+$22,000, or +55.0%). However, because this category carries a 24% realized gross margin, it required $22,000 in additional sales volume just to generate $4,480 in incremental gross margin dollars.
-
Technical Outerwear (Anchor Category Collapse): Revenue dropped from a budgeted $60,000 to $42,000 (-$18,000, or -30.0%). Because this is the business’s premier profit generator (58% target margin), this drop subtracted $12,120 in expected gross profit dollars.
-
The Substitution Effect: The $22,000 surge in accessories masked the $18,000 deficit in outerwear on the revenue dashboard. But replacing $18,000 of outerwear sales with $22,000 of accessories produced a net loss of $7,640 in margin dollars despite generating $4,000 more in top-line cash through the registers.
Promotional & Discount Erosion Analysis
Every product category experienced realized margin rate compression against target:
-
Technical Outerwear Markdown Loss: The 15% end-of-month markdown reduced the realized margin rate from 58% to 54% (-400 bps). On the $42,000 in realized sales, this promotional concession directly bled $1,680 in pure gross profit. The markdown did not stimulate sufficient volume to recover the loss; it merely cheapened the remaining transactions.
-
Trail Footwear Margin Leakage: Revenue beat plan by $1,000 ($51,000 vs. $50,000), but margin rate fell from 44% to 43% (-100 bps). That 1% slip cost $510, which completely eliminated the gross profit from the extra $1,000 in sales ($21,930 actual vs. $22,000 budget). The team handled more inventory to make less money.
-
Camping Accessories Rate Slippage: Realized margin dropped from 26% to 24% (-200 bps), creating $1,240 in rate erosion. The business absorbed additional warehouse handling, transaction fees, and shipping overhead on high-velocity goods at discounted yields.
Total direct margin dollar leakage caused by price and discount degradation alone (excluding volume loss) was $3,430.
Diagnostic Summary Table
| Category | Actual Revenue | Revenue Share | Actual Margin $ | Margin Share∣MarginRate∣Margin Variance vs. Plan |
| Technical Outerwear | $42,000 | 27.10% | $22,680 | 38.12% |
| Trail Footwear | $51,000 | 32.90% | $21,930 | 36.86% |
| Camping Accessories & Tech | $62,000 | 40.00% | $14,880 | 25.01% |
| Total / Blended | $155,000 | 100.00% | $59,490 | 100.00% |
Diagnostic Insight: Camping Accessories generated 40.0% of total company sales, but contributed only 25.0% of gross profit dollars. In contrast, Outerwear accounted for only 27.1% of sales, yet yielded 38.1% of all gross profit dollars.
Operational Action Plan
-
Restrict & Re-Floor Promotions in Low-Margin Categories:
-
Cap promotional discounts on Camping Accessories & Tech at a strict floor of 26% gross margin.
-
De-prioritize accessories on primary digital hero banners and prime front-of-store floor real estate. Cease ad spend on products yielding under 28% margin unless bundled directly with a qualifying full-price outerwear or footwear item.
-
-
Prioritize Volume Recovery for Technical Outerwear:
-
Terminate blanket percentage-off markdowns on current-season Outerwear. Replace them with value-add bundles (e.g., “Purchase a technical shell at full price and receive a technical mid-layer or care kit at 30% off”) to defend the baseline 58% product margin.
-
Reallocate marketing and merchandising spend toward high-margin outerwear traffic acquisition to recover the $18,000 revenue deficit.
-
-
Establish a Minimum Margin Dollar Yield Rule:
-
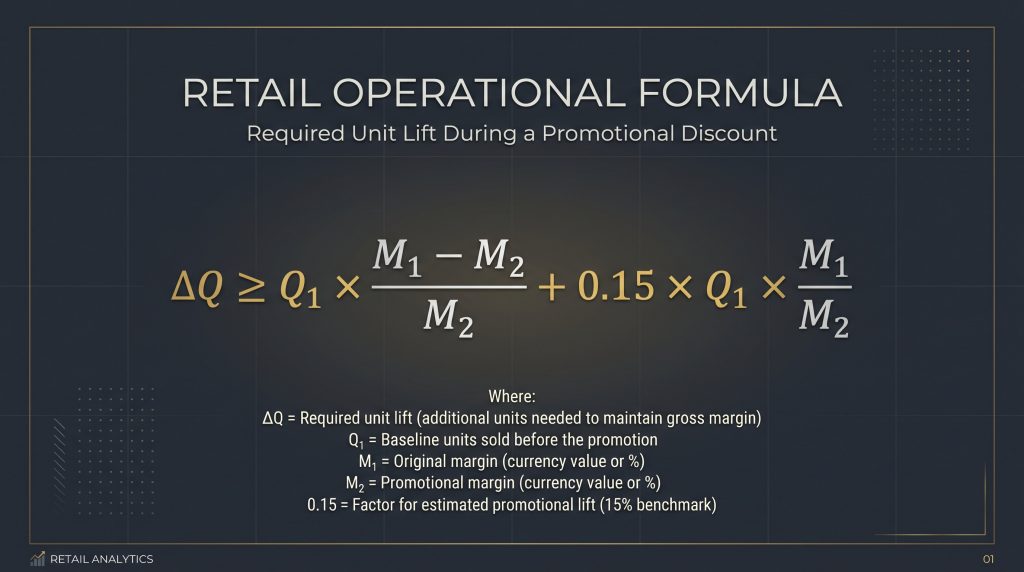
The Hurdle Rule: No promotional event or category markdown may be approved unless projected incremental unit volume increases total gross margin dollars by at least 15% above baseline non-promotional projections.
-
Operational Formula: For an item discounting from margin rate $M_1$ to promotional margin rate $M_2$, required unit lift must satisfy:
-
Under this rule, discounting outerwear from 58% to 54% requires an immediate 23.5% unit sales surge just to meet the 15% profit-growth threshold. If that volume lift cannot be verified, the promotion is automatically rejected.
-