More Traffic Can Make a Weak Store Look Worse
When retail sales flatten, the default reaction across headquarters and store management is almost always the same: bring in more people.
Teams call for marketing pushes, promotional window banners, local ad spend, and higher footfall. The underlying belief feels completely intuitive.
If one hundred people walk through the doors and ten make a purchase, then bringing in two hundred people should yield twenty transactions.
Footfall is treated as the primary fuel of revenue, and the store is viewed as a passive container that simply collects a steady percentage of whatever flows through it.
That mathematical shortcut breaks down the moment a store suffers from execution friction.
Foot traffic does not simply scale sales. Traffic functions as an amplifier.
If a store has strong merchandising, accessible stock, attentive staffing, and an effortless checkout sequence, extra traffic amplifies those strengths into immediate revenue.
But if the store suffers from hidden friction, extra traffic amplifies the dysfunction instead.
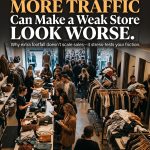
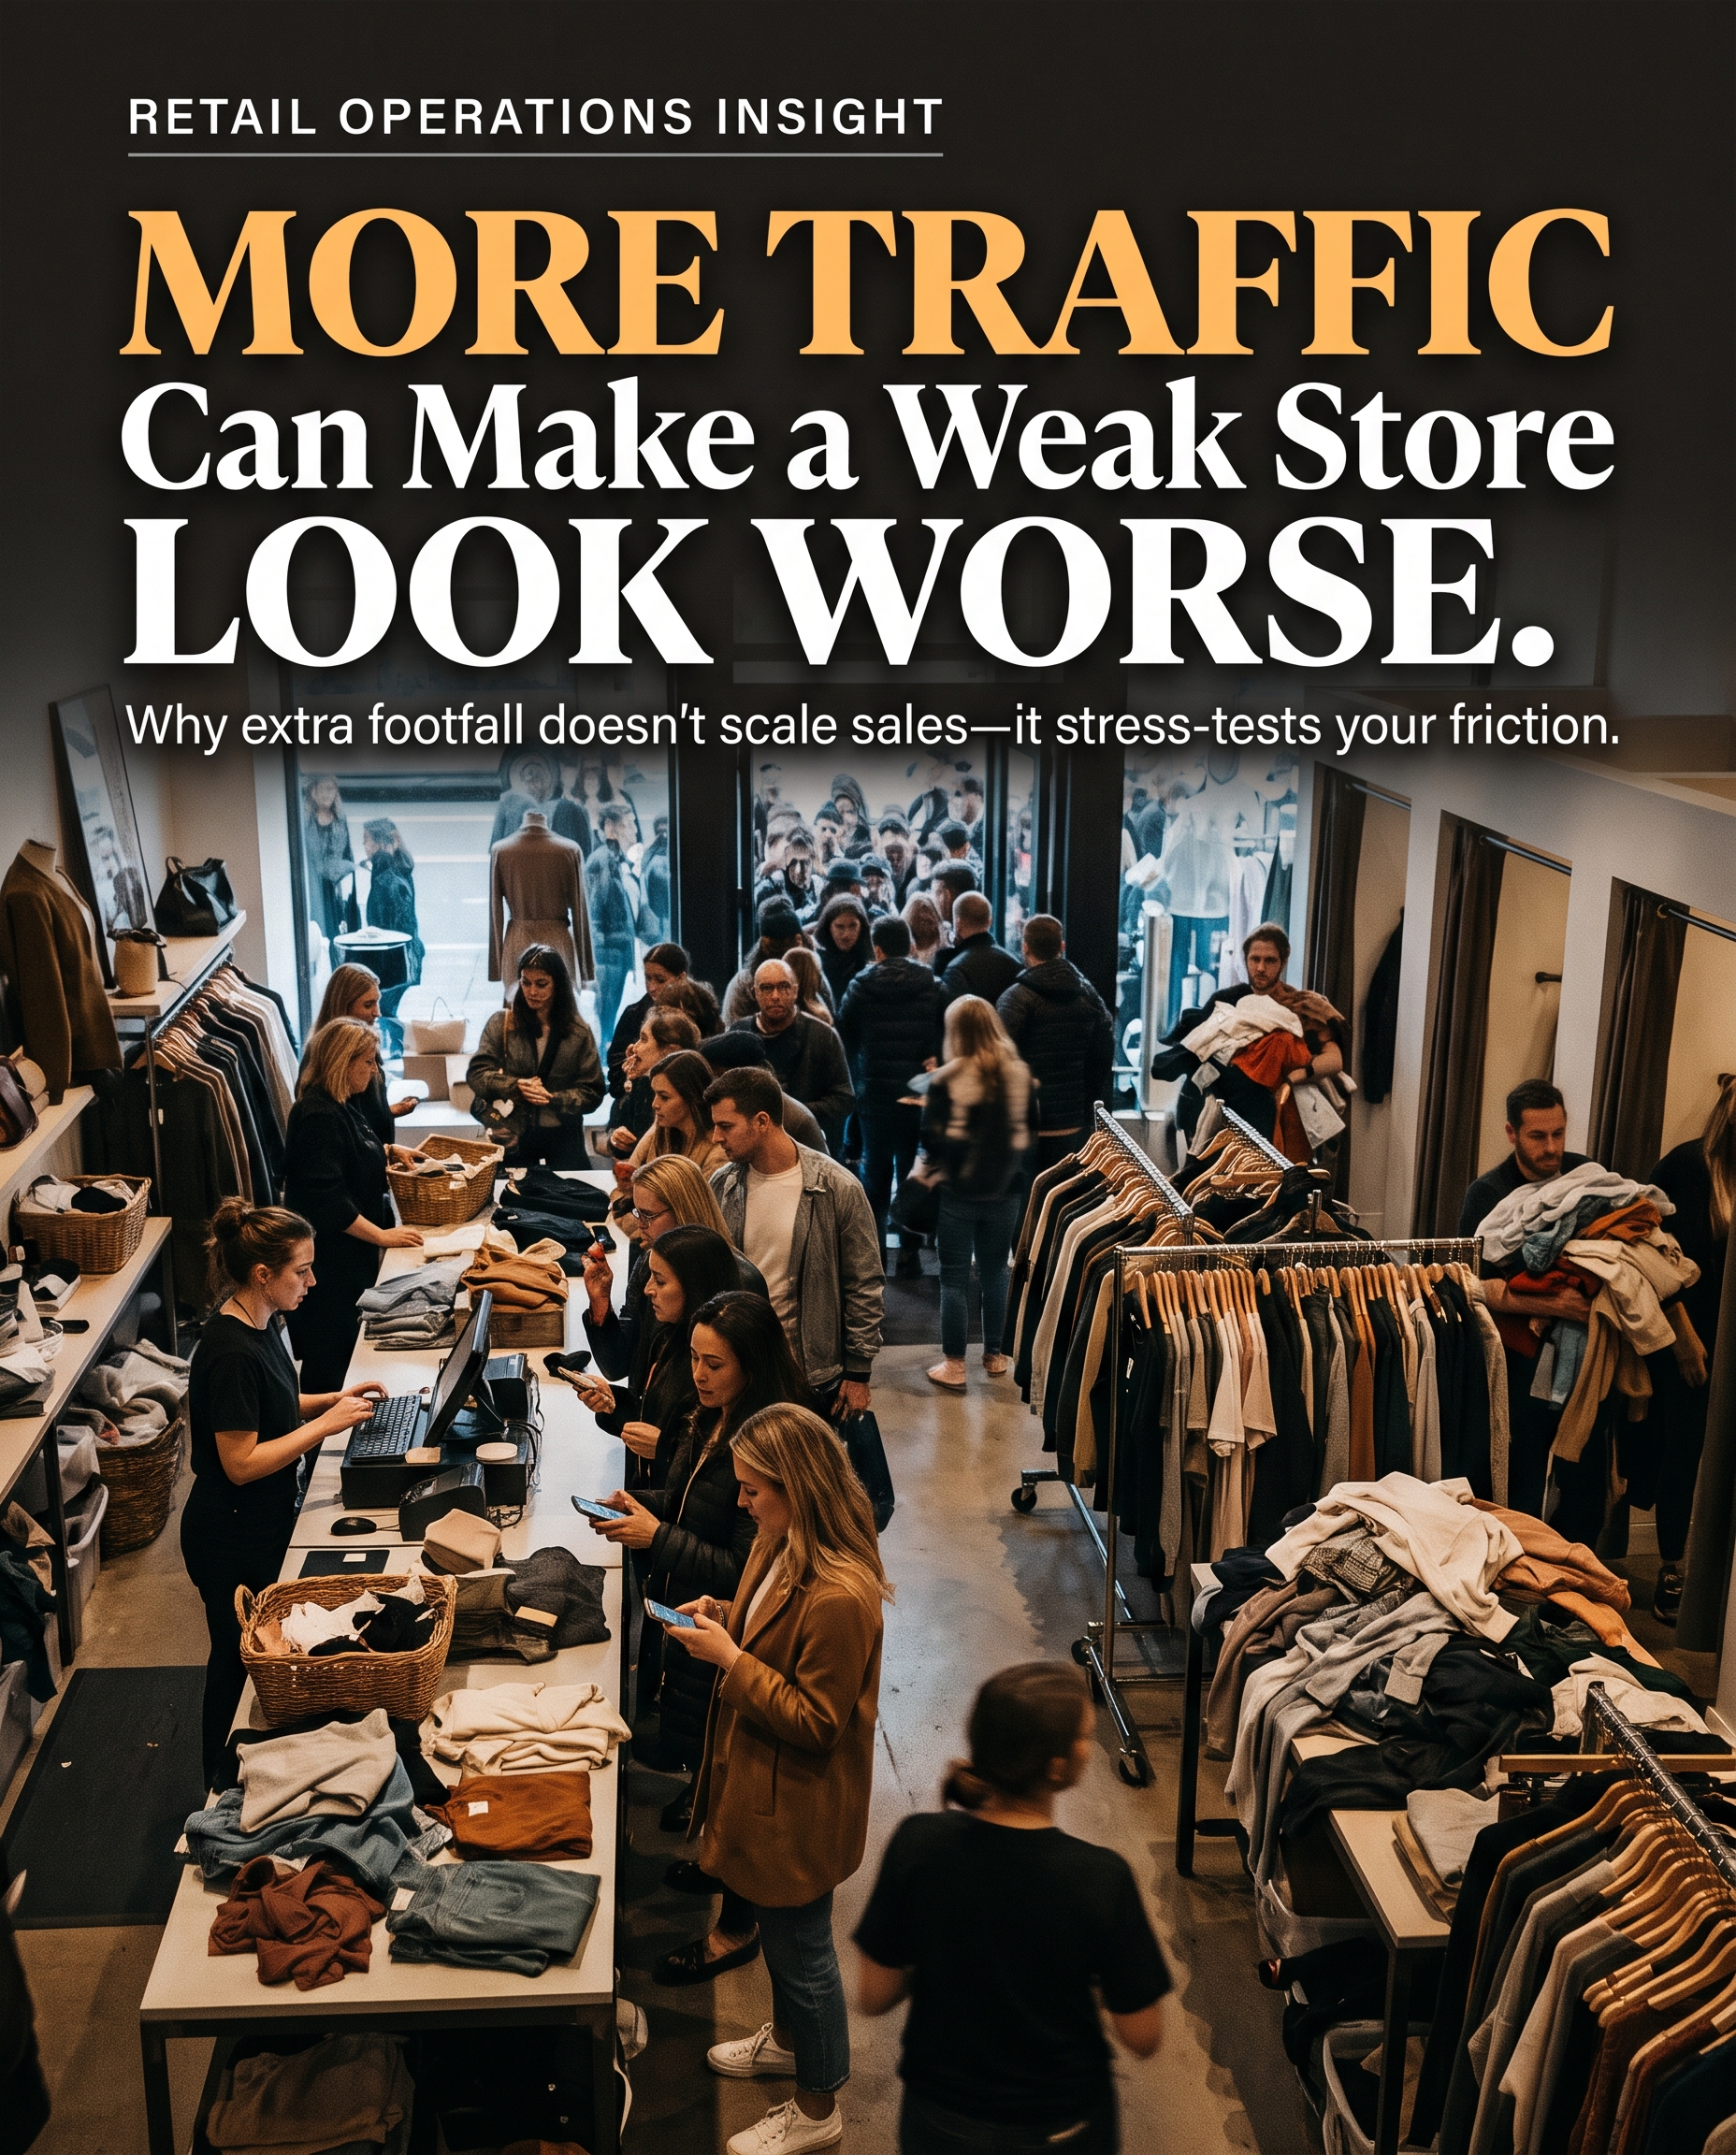
It clogs the sales floor, overwhelms the staff, exposes inventory gaps, creates queues, and drives away high-intent buyers who would have happily purchased on a quieter afternoon.
In retail operations, foot traffic does not fix operational weakness; it stress-tests it. When you funnel more people into an uncalibrated store, you do not just fail to capture extra revenue.
You actively degrade the experience for the demand already standing at the cash register.
The Conversion Stress Curve
To diagnose where revenue is actually slipping away, managers have to stop looking at traffic and conversion as independent performance metrics. They exist in direct operational tension.
In a healthy retail model, conversion rate should hold relatively steady across moderate swings in volume. In a fragile model, traffic increases are accompanied by a steep drop in conversion.
This pattern reveals the operation’s conversion stress point: the specific customer volume at which floor execution begins to deteriorate and net transactions flatline or decline.
Consider how shopping behavior changes when footfall increases in a store that has not solved its operational bottlenecks.
A quiet store hides many operational flaws. If a customer cannot find their size on a rack, a solitary sales associate has time to search the backroom.
If an item lacks a barcode, the cashier can manually look it up without causing a scene. If the fitting room is disorganized, an associate can clear it between visits.
The store converts at an acceptable rate only because the staff spends surplus labor compensating for broken systems.
When traffic doubles, that compensatory buffer disappears instantly.
The backroom search now means three other shoppers on the sales floor are completely ignored.
The barcode delay at the register creates a four-person queue, which triggers the visual threshold where browsing shoppers decide to put their potential purchases down and walk out.
The fitting rooms back up, garments pile up on return racks rather than returning to display tables, and high-margin inventory becomes functionally invisible.
The store appears bustling from the outside. Footfall counts look triumphant on the morning dashboard.
Yet at the end of the day, total units sold remain flat, average order value drops, and conversion plunges.
The operational reality can be distilled into a single diagnostic rule: traffic creates opportunity, but operations determine yield.
When footfall rises while conversion falls sharply, marketing did its job and the store failed its audit.
Anatomy of an Operational Collapse
To see how this mechanism plays out in practice, look at a mid-sized specialty apparel store operating in a high-density shopping corridor.
On an average Tuesday afternoon, the store receives roughly 40 visitors per hour.
Staffing sits at three associates: one managing the register, one greeting and staging fitting rooms, and one maintaining floor visual standards and answering questions.
Under this volume, the store operates comfortably:
-
Hourly traffic: 40 shoppers
-
Conversion rate: 22 percent
-
Total transactions: ~9 per hour
-
Average transaction value: $85
-
Hourly revenue: $765
Seeing solid margins, regional leadership decides to run a weekend promotional campaign to drive volume. Marketing spends heavily on localized digital campaigns and geo-targeted promotions.
On Saturday afternoon, the campaign succeeds in driving foot traffic to 100 visitors per hour, a 150 percent increase in raw opportunity.
Store leadership expects sales to follow that curve. If conversion holds at 22 percent, the store should produce 22 transactions per hour and roughly $1,870 in revenue.
Instead, the Saturday afternoon results tell a completely different story:
-
Hourly traffic: 100 shoppers
-
Conversion rate: 9 percent
-
Total transactions: 9 per hour
-
Average transaction value: $70
-
Hourly revenue: $630
The store brought in two and a half times the foot traffic and actually generated less revenue than on a routine weekday.
What happened on the floor was not a failure of customer interest; it was an operational traffic jam.
The queue at the cash wrap reached six people deep, causing casual buyers to abandon small baskets.
The single associate assigned to the fitting rooms could not inspect, clear, and return garments fast enough, meaning the top eight selling styles were trapped inside stalls rather than available on floor fixtures.
The visual associate was pulled into dispute resolution and checkout relief, leaving display tables chaotic and uninviting.
Shoppers with high purchasing intent arrived, assessed the friction, and left without spending a dollar. The extra footfall did not provide growth.
It diluted customer service, hid core merchandise, and degraded the store environment until even guaranteed sales were lost.
Diagnosing Capacity Before Driving Demand
Before spending capital or time trying to drive extra footfall, retail leaders must run a capacity audit on their existing floor conversion.
The goal is to determine whether the store is traffic-constrained or conversion-constrained.
A traffic-constrained store is operationally sound: its displays are fully stocked, queues are short, fitting rooms turn over in under two minutes, staff engagement occurs within the first sixty seconds of entry, and conversion remains stable during unexpected micro-peaks.
When you send another fifty shoppers into this environment, revenue scales predictably because the pipes are clear.
A conversion-constrained store displays clear, measurable warning signals:
First, look for the queue-abandonment threshold. Track the exact number of people waiting at the point of sale when walkouts begin to accelerate.
If a queue of four or more customers reliably produces basket dumps near the exit, driving more footfall will simply create longer lines that actively turn away your highest-margin shoppers.
Second, examine fitting room dwell time and recovery speed.
If garments tried on during peak hours take more than fifteen minutes to return to the sales floor, your best inventory is absent when the highest volume of potential buyers is looking for it.
Adding traffic under these conditions means your most interested shoppers are browsing depleted shelves while the actual stock sits in holding stalls.
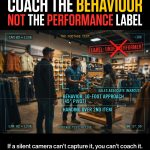
Third, observe staff posture during peak spikes. When footfall increases, do associates engage customers more frequently, or do they retreat into transactional survival mode?
When floor staff spends the majority of their shift managing logistical messes, processing returns, and calming impatient shoppers in line, customer-assisted selling drops to zero.
If your conversion rate drops significantly whenever traffic spikes by more than twenty percent, your problem is not customer acquisition.
You have an operational bottleneck masquerading as a demand issue.
The Decision Rule for Store Growth
When facing flat revenue, do not ask how to get more people into the store. Ask what percentage of existing traffic leaves empty-handed, and precisely where in the store journey that drop-off happens.
Apply this practical test every Monday morning when reviewing floor metrics: compare your peak footfall hours against your non-peak hours.
If your highest-traffic hours generate a lower conversion rate than your moderate-traffic hours, your immediate investment must go toward floor speed, checkout velocity, inventory recovery, and customer interaction, not marketing.
Every shopper who walks out of an overwhelmed store without buying is not merely a missed transaction; they are a damaged brand impression who experienced your store at its absolute worst.
Solve for the friction at your existing volume first.
Once the store can convert the quiet hours and the moderate hours with equal consistency, every additional person through the door becomes genuine margin rather than operational noise.
The quiet discipline of retail is recognizing that growth is rarely about expanding the crowd.
It is about making sure the store does not buckle under the weight of the customers who already showed up to buy.
AI Diagnosis
AI Prompt
Act as an expert retail operations analyst. I want you to evaluate my store’s floor efficiency and determine whether my business is traffic-constrained or conversion-constrained based on this snapshot of my store: [INSERT YOUR STORE TYPE, PEAK VS. NON-PEAK METRICS, AND FLOOR OBSERVATIONS HERE. For example: “We run an independent women’s boutique. On quiet weekday afternoons, we average 25 visitors per hour, 6 transactions (24% conversion), an average ticket of $80, and 2 staff on duty. On Saturday afternoons, foot traffic jumps to 85 visitors per hour, but we only complete 11 transactions (13% conversion) with an average ticket of $65 and 4 staff on duty. Lines at the register regularly reach 5 to 6 people, dressing room stalls stay backed up with clothes piling up on staging tables, and associates spend nearly all their time ringing up items and managing line frustration rather than assisting shoppers on the floor.”]. Using this data, diagnose where my floor hits its conversion stress point where added footfall actually dilutes sales. Structure your response into three clear sections: first, calculate our operational yield gap by showing the estimated lost transactions and revenue during peak hours compared to our baseline conversion rate; second, pinpoint the specific floor friction bottlenecks that are causing high-intent shoppers to walk out empty-handed (evaluating queue abandonment, inventory lockout in fitting rooms or backrooms, and staff survival mode); and third, give me a prioritized, immediate action plan to fix floor velocity, staffing deployment, and inventory recovery so our existing traffic converts before we spend another dollar on customer acquisition. Clearly label any operational assumptions as inferences and keep your recommendations practical and specific to my store environment.
AI Output
Your boutique is strictly conversion-constrained. The 240% increase in customer traffic on Saturdays produces only a 49% increase in gross sales because your revenue-per-visitor collapses from $19.20 on weekdays down to $8.41 on Saturdays.
Foot traffic is not expanding your business; it is overwhelming your floor systems and repelling qualified, high-intent buyers.
1. The Operational Yield Gap
When customer volume triples, the store’s capacity to process sales breaks down. The baseline metrics prove that when customer interactions are unhurried, your team converts 24% of visitors at an $80 average order value (AOV).
On Saturday, the conversion rate falls by nearly half (to 13%), and ticket size drops by 19% (to $65).
| Metric | Weekday Baseline (Off-Peak) | Saturday Actual (Peak) | Saturday Potential (At Baseline Efficiency) | Peak Variance / Gap |
| Foot Traffic | 25 shoppers / hr | 85 shoppers / hr | 85 shoppers / hr | — |
| Staff on Duty | 2 associates | 4 associates | 4 associates | +2 associates |
| Conversion Rate | 24.0% | 12.9% (~13%) | 24.0% | -11.1% |
| Completed Transactions | 6 / hr | 11 / hr | 20.4 / hr | -9.4 transactions / hr |
| Average Order Value (AOV) | $80.00 | $65.00 | $80.00 | -$15.00 / ticket |
| Hourly Revenue | $480.00 | $715.00 | $1,632.00 | -$917.00 / hr |
| Revenue Per Visitor (RPV) | $19.20 | $8.41 | $19.20 | -$10.79 / visitor |
(Operational Inference: Assuming an average Saturday peak period of 5 operational hours between 12:00 PM and 5:00 PM)
-
Lost Transactions: ~47 sales abandoned per Saturday afternoon.
-
Direct Revenue Leakage: $4,585 lost every Saturday ($917/hr × 5 hours) compared to baseline efficiency.
-
Annualized Opportunity Cost: Over $238,000 in uncaptured gross revenue per year solely from unmanaged Saturday floor friction.
Even under a conservative assumption where Saturday’s compressed $65 AOV remains unchanged, capturing your baseline 24% conversion rate would yield $1,326/hr, leaving a net loss of $611/hr ($3,055 per Saturday).
2. Root-Cause Friction Bottlenecks
The drop from 24% to 13% conversion is not a change in customer demand; it is a physical barrier erected by three compounding floor failures:
-
Queue Abandonment at the 5-Customer Threshold: In specialty retail, an unmoving line of 5 to 6 people at a single wrap counter acts as an immediate visual exit cue. Shoppers holding one or two items calculate the wait against the perceived value and dump items on nearby fixtures. (Inference: This explains the drop in AOV from $80 to $65; multi-item basket builders leave or strip down their selection to justify the wait).
-
Inventory Lockout in Fitting Rooms: In apparel, the highest-converting space in the entire store is the fitting room. When stalls accumulate garments and staging tables overflow, two negative events happen simultaneously:
-
Friction walkouts: Shoppers ready to try on garments face a delay or a cluttered space and walk away.
-
Floor starvation: Your highest-demand, best-selling inventory—the exact sizes and styles currently being tried on—remains trapped off the sales floor during the hours with the highest density of shoppers.
-
-
Staff Survival Mode vs. Assisted Selling: On weekdays, 2 staff members handle 25 guests (12.5 visitors per staff member), allowing natural styling advice, size runs, and greeting. On Saturdays, 4 staff members handle 85 guests (21.25 visitors per staff member). Because the register and fitting rooms are bottlenecked, all 4 associates default to transactional triage: managing registers, apologizing for wait times, and untangling hangers. Floor engagement drops to zero, killing accessory add-ons and upselling.
3. Prioritized Immediate Action Plan
Do not spend any additional capital on driving footfall until these three operational fixes are locked in.
Priority 1: Implement Fixed Role Specialization (Eliminate Float Chaos)
Stop allowing staff to multitask organically when traffic passes 50 visitors per hour. Assign strict zones during peak hours:
-
The Anchor Cashier (1 Associate): Dedicated strictly to ringing up sales and packaging. Does not leave the counter to retrieve sizes or answer inventory questions.
-
The Fitting Room Quarterback / Inventory Runner (1 Associate): Stationed at the stalls. Their only job is sizing customers, assigning stalls, and immediately returning tried-on garments back to the sales floor within a 5-minute cycle to keep fast-moving inventory live.
-
Floor Stylists (2 Associates): Stationed in key selling zones to greet within 30 seconds, start dressing room fitting baskets, and provide active styling support.
Priority 2: Deploy Mobile “Line-Busting” at the Cash Wrap
-
Equip one floor stylist with a mobile POS tablet or card reader.
-
When the queue reaches 3 people, the mobile associate steps up to ring card-only, single-item transactions directly from the line or pre-scan barcode tags into a digital basket hold to cut register dwell time in half.
Priority 3: Establish a “Hot-Rack” Staging Protocol
-
Dedicate a mobile rolling rack directly behind the fitting room staging area specifically for same-day trending styles.
-
Instead of refolding and rehanging garments in the back room or staging piles, steam and return items directly back to primary tables on a strict 15-minute timer. High-intent Saturday shoppers buy what is on display; inventory trapped in stalls produces zero yield.