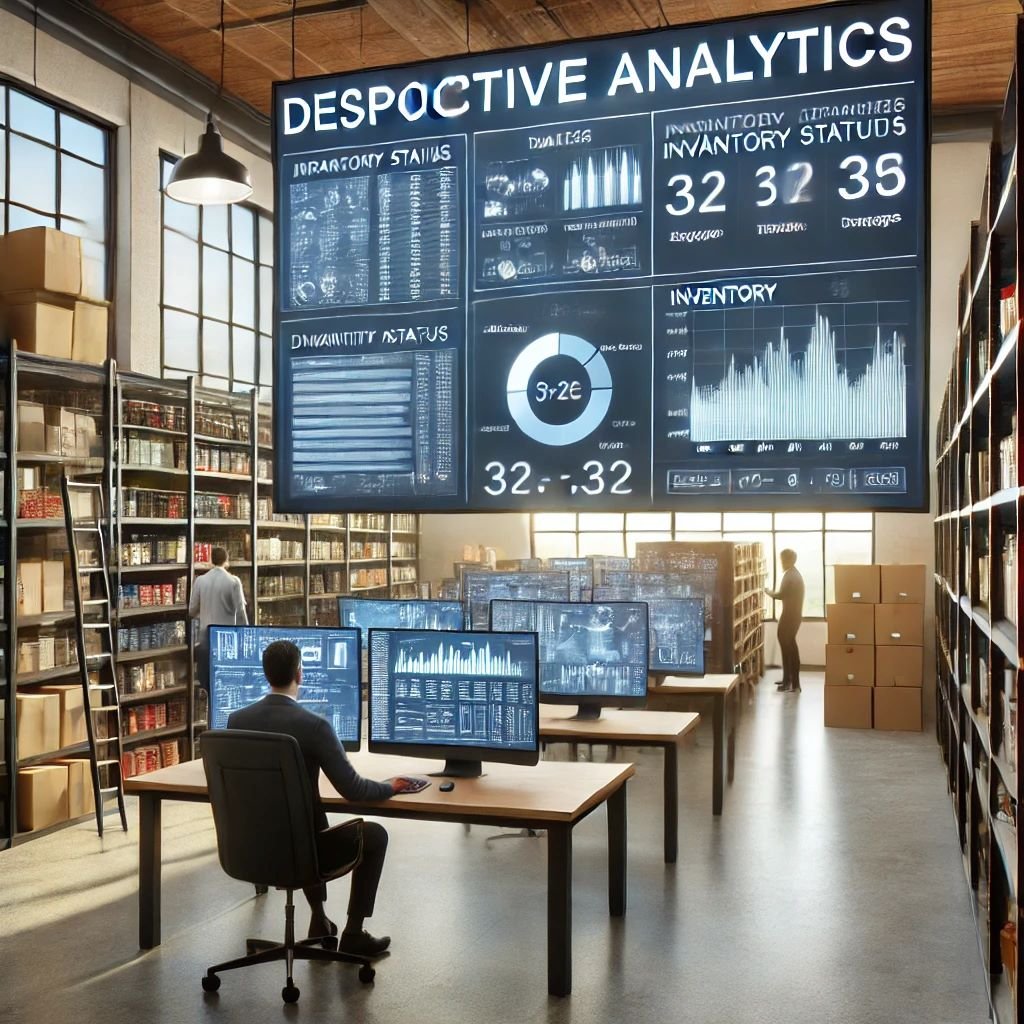
Descriptive Analytics in Retail: Summarizing Inventory Status and Identifying Patterns and Trends
Descriptive analytics involves analyzing historical data to understand what has happened in the past.
In the retail context, this type of analysis helps businesses summarize current inventory status, identify patterns and trends, and make informed decisions based on data-driven insights.
This comprehensive report explores the various aspects of descriptive analytics, focusing on its application in summarizing inventory status and identifying patterns and trends in retail.
Overview of Descriptive Analytics
Descriptive analytics uses statistical techniques and tools to analyze historical data, providing insights into past performance and current status.
It answers the question, “What happened?” by transforming raw data into meaningful summaries.
Key components of descriptive analytics include data aggregation, data mining, and data visualization.
Summarizing Current Inventory Status
1. Inventory Levels and Turnover
Understanding current inventory levels is crucial for effective inventory management.
Descriptive analytics provides a detailed overview of the stock on hand, stock on order, and inventory turnover rates. Key metrics include:
- Stock on Hand (SOH): The total quantity of inventory currently available in the warehouse or store.
- Stock on Order (SOO): The quantity of inventory that has been ordered but not yet received.
- Inventory Turnover Rate: The rate at which inventory is sold and replaced over a specific period.
- It is calculated as: Inventory Turnover Rate=Cost of Goods Sold (COGS) / Average Inventory
By analyzing these metrics, retailers can determine if they are overstocked, understocked, or maintaining optimal inventory levels.
2. Stockout and Overstock Analysis
Descriptive analytics helps identify instances of stockouts (when inventory levels are insufficient to meet demand) and overstock (when inventory levels exceed demand).
Key insights include:
- Stockout Rate: The frequency of stockouts, calculated as: Stockout Rate = Number of Stockouts x 100 / Total Number of Inventory Items
- Overstock Rate: The frequency of overstock situations, which can be identified by comparing actual inventory levels to desired inventory levels.
Analyzing stockout and overstock rates helps retailers adjust their inventory management strategies to balance supply and demand effectively.
3. Ageing Analysis
Ageing analysis provides insights into how long inventory items have been in stock.
This analysis helps identify slow-moving or obsolete inventory that may require markdowns or promotions to clear. Key metrics include:
- Average Age of Inventory: The average number of days that items have been in stock.
- Ageing Buckets: Categorizing inventory into different age groups (e.g., 0-30 days, 31-60 days, etc.) to identify items that have been in stock for extended periods.
By conducting ageing analysis, retailers can optimize their inventory turnover and reduce holding costs.
Identifying Patterns and Trends in Retail
1. Sales Trends
Descriptive analytics helps identify sales trends over time, providing insights into seasonal variations, peak periods, and long-term growth patterns.
Key techniques include:
- Time Series Analysis: Analyzing sales data over time to identify patterns and trends. This includes identifying seasonality (recurring patterns) and trends (long-term movements).
- Moving Averages: Calculating moving averages to smooth out short-term fluctuations and highlight long-term trends.
Understanding sales trends allows retailers to adjust their inventory levels, marketing strategies, and staffing to align with demand patterns.
2. Customer Behavior Analysis
Analyzing customer behavior helps retailers understand purchasing patterns, preferences, and loyalty. Key insights include:
- Purchase Frequency: The average number of purchases made by customers over a specific period.
- Average Order Value (AOV): The average amount spent by customers per transaction.
- Customer Segmentation: Grouping customers based on purchasing behavior, demographics, and preferences to tailor marketing strategies.
By analyzing customer behavior, retailers can personalize their offerings, improve customer satisfaction, and increase sales.
3. Product Performance Analysis
Descriptive analytics provides insights into the performance of individual products and product categories. Key metrics include:
- Top-Selling Products: Identifying products with the highest sales volume and revenue.
- Product Return Rates: Analyzing the frequency and reasons for product returns to identify quality issues or mismatches with customer expectations.
- Category Performance: Assessing the performance of different product categories to identify growth opportunities and areas for improvement.
Product performance analysis helps retailers optimize their product assortment and inventory levels.
4. Market Basket Analysis
Market basket analysis examines the relationships between products that are frequently purchased together.
This analysis helps retailers identify cross-selling and upselling opportunities. Key techniques include:
- Association Rules: Identifying patterns and correlations between products based on historical sales data. For example, if customers frequently buy bread and butter together, the retailer can create promotional bundles or cross-merchandising strategies.
- Lift and Confidence: Calculating lift (the strength of the association) and confidence (the likelihood of products being purchased together) to prioritize cross-selling opportunities.
Market basket analysis enhances merchandising strategies and increases average order value.
Tools and Technologies for Descriptive Analytics
1. Business Intelligence (BI) Tools
BI tools such as Tableau, Power BI, and Qlik Sense provide powerful data visualization and analysis capabilities.
These tools help retailers create interactive dashboards, generate reports, and gain insights from their data.
- Tableau: Offers a user-friendly interface for creating detailed visualizations and dashboards. It supports a wide range of data sources and provides advanced analytics features.
- Power BI: A Microsoft tool that integrates seamlessly with other Microsoft products. It offers robust data visualization, reporting, and sharing capabilities.
- Qlik Sense: Provides associative data indexing and interactive visualizations, allowing users to explore data and uncover insights.
2. Data Warehousing
Data warehousing solutions consolidate data from various sources into a central repository, enabling comprehensive analysis.
Popular data warehousing platforms include:
- Amazon Redshift: A fully managed data warehouse service that provides fast query performance and scalability.
- Google BigQuery: A serverless, highly scalable data warehouse that allows for real-time analysis of large datasets.
- Snowflake: A cloud-based data warehousing platform that offers flexibility, scalability, and advanced analytics capabilities.
3. Machine Learning and AI
Machine learning and AI technologies enhance descriptive analytics by automating data processing and generating deeper insights.
These technologies can identify patterns, trends, and anomalies that may not be apparent through traditional analysis.
- Machine Learning Algorithms: Algorithms such as clustering, regression, and classification can be used to analyze and interpret large datasets.
- AI-Powered Analytics Platforms: Platforms like IBM Watson and Google AI provide advanced analytics capabilities, including natural language processing and predictive modeling.
Benefits of Descriptive Analytics in Retail
1. Informed Decision-Making
Descriptive analytics provides retailers with actionable insights, enabling data-driven decision-making.
By understanding past performance and current status, retailers can make informed choices about inventory management, marketing strategies, and operational improvements.
2. Improved Efficiency
Analyzing inventory data helps retailers identify inefficiencies and areas for improvement.
This includes optimizing stock levels, reducing holding costs, and streamlining operations.
3. Enhanced Customer Experience
By understanding customer behavior and preferences, retailers can personalize their offerings and create targeted marketing campaigns.
This improves customer satisfaction and loyalty.
4. Increased Sales and Profitability
Identifying sales trends, product performance, and cross-selling opportunities helps retailers increase sales and profitability.
By aligning inventory levels with demand patterns, retailers can minimize stockouts and overstock situations.
Challenges and Considerations
1. Data Quality
The accuracy and reliability of descriptive analytics depend on the quality of the underlying data.
Retailers must ensure that their data is clean, complete, and accurate to generate meaningful insights.
2. Integration
Integrating data from multiple sources can be challenging.
Retailers need to ensure that their data systems are compatible and that data flows seamlessly between different platforms.
3. Expertise
Descriptive analytics requires expertise in data analysis and interpretation.
Retailers may need to invest in training or hire skilled analysts to leverage the full potential of their data.
Descriptive analytics plays a crucial role in retail by summarizing current inventory status and identifying patterns and trends.
By leveraging advanced tools and technologies, retailers can gain valuable insights into their operations, optimize inventory management, and enhance customer experiences.
As the retail landscape continues to evolve, the importance of data-driven decision-making will only grow, making descriptive analytics an essential component of modern retail strategies.


